
How to Look Up DuPage Jail Population Data
DuPage publishes population data in three places. The Sheriff's annual reports, the state Jail and Detention Standards Unit inspection reports, and the federal Bureau of Justice Statistics jail report each cover a slice of the same picture. The Sheriff's site also routes specific data requests through a FOIA office, which is the path for figures that are not already published.
The Sheriff's correctional facility page is the front page for jail information. Open it to find the inmate search, visitation, and links to current reports.
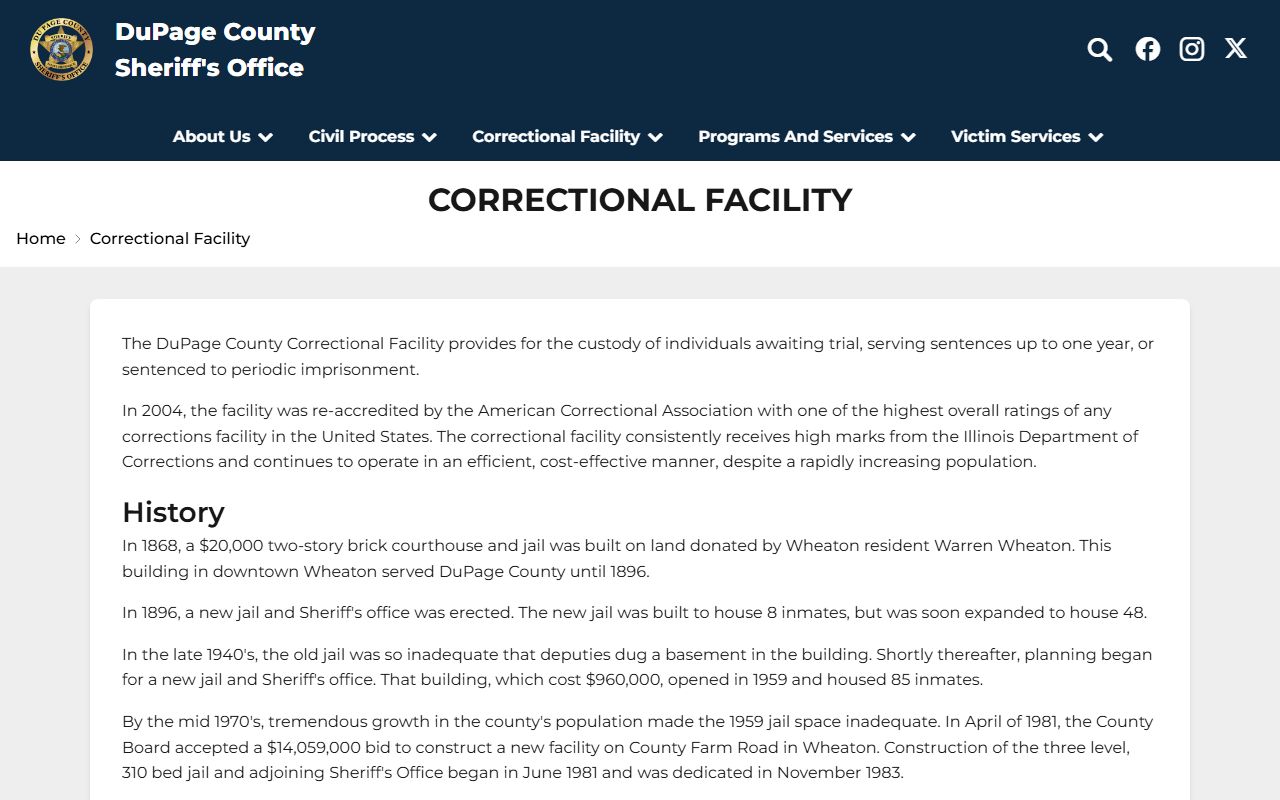
The facility page is updated as the Sheriff posts new reports, new programs, or new visitation guidance.
DuPage Jail Capacity Overview
The DuPage County Correctional Facility is the main jail for the county. The facility houses pretrial detainees, sentenced county inmates, holds for state and federal agencies, and people in periodic imprisonment. Exact published capacity changes as the Sheriff renovates units or adjusts classification.
| Facility | Address | Operator | Notes |
|---|---|---|---|
| DuPage County Correctional Facility | 501 N. County Farm Road, Wheaton, IL 60187 | DuPage County Sheriff | Main county jail; capacity published in annual reports and inspection records. |
The Sheriff's annual reports are the most reliable single source for current capacity. The Illinois Jail and Detention Standards inspection reports back the Sheriff data with a state-level audit.
Average Daily Population
Average daily population, or ADP, is the figure most commonly used to describe jail crowding. ADP averages the daily count of people in custody across a full calendar period. The DuPage figure tracks pretrial detainees, sentenced county inmates, and people held under periodic imprisonment. Local ADP changes with arrests, court backlogs, and pretrial release decisions made under the Pretrial Fairness Act.
BJS publishes national jail statistics each year. Open the Bureau of Justice Statistics site for national jail population context and methodology notes.
National numbers help frame whether a DuPage trend is a local event or part of a national pattern.
Demographic Breakdown
Demographic figures cover sex, race, age band, and offense category. Detailed DuPage demographics are not always in the Sheriff's public summary, but they appear in some annual reports and in state inspection data. National research groups offer comparison points.
Prison Policy Initiative publishes state and county profiles that compare DuPage data to other Illinois counties. Open prisonpolicy.org for the state-level summary and the underlying data sources.
Prison Policy data is independent research and not an official county source, but it pairs well with the Sheriff's published figures.
Pretrial vs. Sentenced Population
One of the most important splits in a jail population is pretrial versus sentenced. People held pretrial have not been convicted, while sentenced inmates are serving a county sentence. The Illinois Pretrial Fairness Act shifted how the state handles cash bond and pretrial release, and most release decisions now come out of a judicial release hearing.
| Population Group | Description |
|---|---|
| Pretrial detainees | People held while a case is pending; not convicted. |
| Sentenced county inmates | People serving a sentence of a year or less in county jail. |
| Periodic imprisonment | Work-release style sentence under Illinois statute. |
| Holds and transfers | People held for other agencies, including state, federal, or out-of-county. |
National benchmarks for the pretrial share come from BJS and Vera Institute. The Vera incarceration-trends tool covers DuPage and other Illinois counties with comparable methodology.
Misdemeanor vs. Felony Population
County jails hold people with misdemeanor and felony cases. The misdemeanor share tends to include traffic-related offenses, lower-grade theft and battery, and certain drug possession cases. The felony share includes higher-grade theft and battery, drug offenses with intent to deliver, weapons offenses, and violent crime. A national jail report typically reports each share separately, and the Sheriff's annual report can do the same for DuPage.
Mental Health and Medical Population
The DuPage Sheriff's site lists Mental Health Reentry, the Recovery Program, Medicated Assisted Recovery, and Veterans Mental Health Information among the corrections programs. The number of inmates in any of these programs at a given moment is a meaningful subset of the population. The PREA program covers the safety obligations of the facility under federal law and reports separately from the medical and mental-health programs.
National and State Context
Comparison data is helpful when reading a DuPage figure. The Vera Institute's incarceration-trends tool covers Illinois counties with the same methodology used for national reporting. Vera's site is a useful companion to BJS. Open the Vera incarceration trends tool to pull DuPage and Illinois figures.
Note: County-level numbers in any single tool may lag the Sheriff's most recent annual report by a few months; cross-check the date stamp on each source before relying on a figure.
A common framework for population research uses three benchmarks: the county rate per 100,000 residents, the state rate per 100,000, and the national rate per 100,000. Each rate divides the average daily population by the relevant denominator population and multiplies by 100,000. The three figures together show whether DuPage runs above, below, or near the state and national norms.
Program Alternatives That Lower the Jail Count
Several DuPage and Illinois programs lower the headcount by routing eligible people out of cells and into supervised alternatives. Periodic Imprisonment lets some sentenced people serve a sentence in segments while keeping a job. S.W.A.P., the Sheriff's Work Alternative Program, lets eligible sentenced people work supervised community projects instead of staying in custody. Mental Health Reentry and the Medicated Assisted Recovery Program route people with treatment needs into services rather than into long custody. The Mandatory Arbitration Program does not affect jail population but does help the civil docket move faster.
The Pretrial Fairness Act also lowered the share of pretrial detainees in many Illinois counties by replacing the cash-bond schedule with a release hearing. The net effect on DuPage shows up most clearly when the 2022 ADP is compared with later years.
Population Trends Over Time
Comparing 2019 pre-pandemic figures to 2020 and 2021 pandemic declines and to 2022 through 2026 rebound and stabilization gives a useful long arc. DuPage published Sheriff annual reports for 2019, 2020, 2021, 2022, and 2023 that hold the underlying figures. State inspection reports add capacity and compliance detail. The combined picture is the truest read on how the population has shifted.
Population swings can be driven by court backlog, charging decisions, sentencing trends, holds for other agencies, and program enrollment. A DuPage figure that rises in one quarter without a related rise in arrests usually points to a slower court calendar rather than more crime.
Researchers comparing years should also note that the Pretrial Fairness Act changed the legal framework mid-stream in late 2023, so any clean comparison of pretrial detention rates before and after that change should be read with the statutory change in mind.
Searching DuPage Inmate Records by Name
This page covers population data. Individual inmate name lookups belong on the DuPage inmate records page, which leads to the Sheriff's JailTracker roster. Search the roster by name for current custody and use the released inmates page for state and federal release searches.
Where the Data Comes From
The DuPage figures are pulled from the Sheriff's published annual reports, the 2024 DuPage County Jail Inspection PDF, BJS jail population annual reports, Vera incarceration trends, and Prison Policy Initiative state pages. Specific data that is not already published can be requested through the Sheriff's FOIA office.
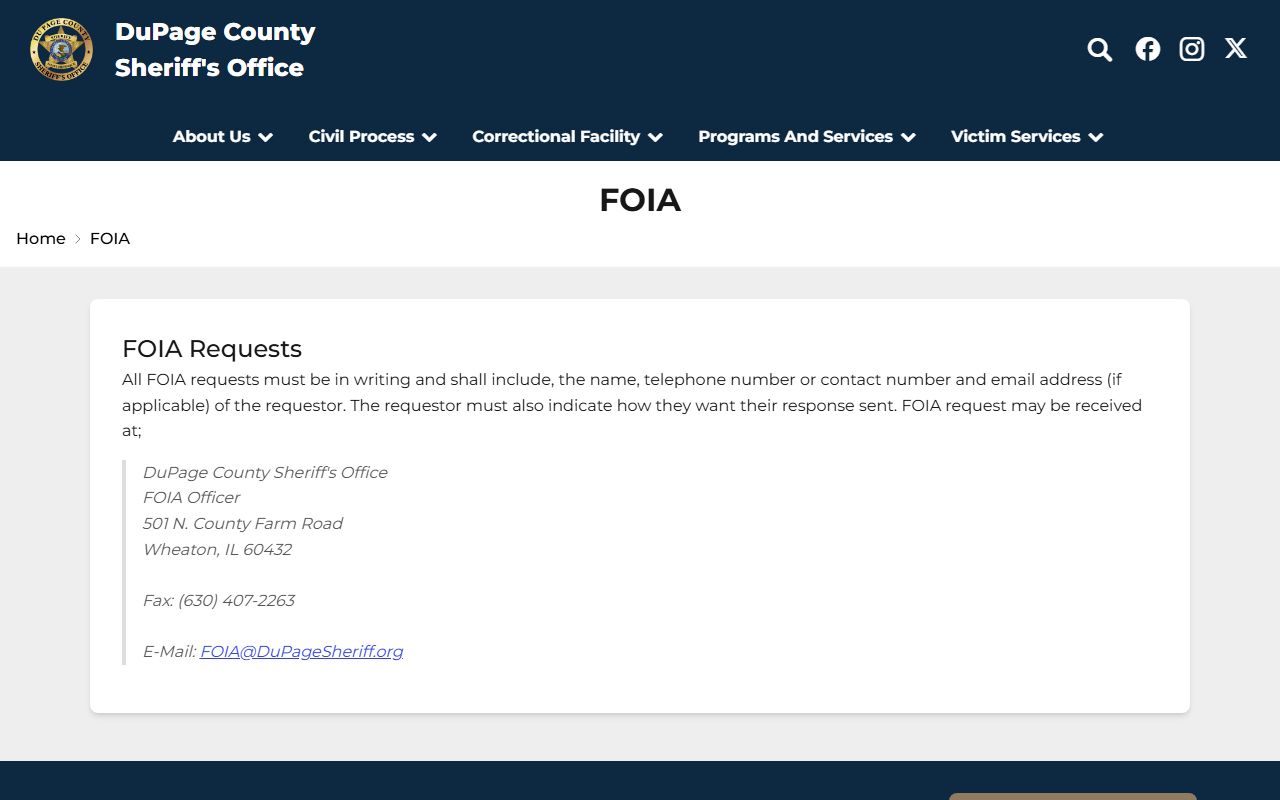
FOIA requests are the right route when a needed figure does not appear in the Sheriff's published reports. The Sheriff's FOIA page describes how to file a request and what to expect.
Federal bankruptcy data sometimes intersects with jail data through restitution and fines; the official U.S. Bankruptcy Court Northern District of Illinois site is the source for that side of the picture.
Bankruptcy records do not appear in the jail roster, but they can intersect with financial obligations a person carries on a DuPage case.